Post-processing can be the most satisfying part of the modeling process. If for no other reason than that it means you are almost done! And, of course, this is where we are able to view and interrogate our hard-earned solutions in full color. COMSOL already provides a broad toolset for visualizing your data pretty much however your heart desires
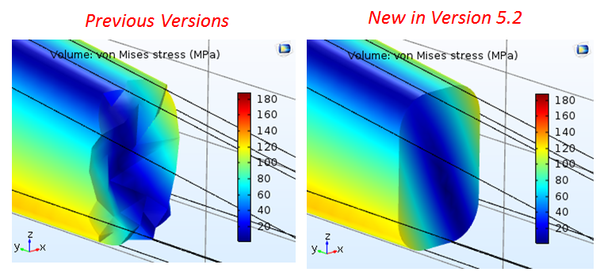
and every release sees even more and better functionality. Recently, we discovered a really nice improvement in v5.2 relating to Filters.
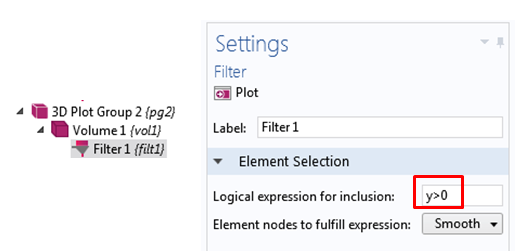
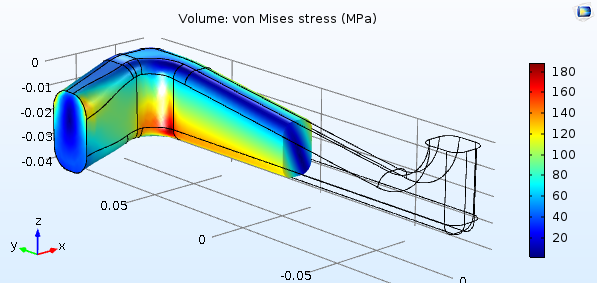
You are probably aware that we can always limit the Selection of our data sets before visualizing to essentially hide domains we don’t want to see, but how do I see inside a 3D domain? Well, this is a great use of the “Filter” subnode. Most plot types allow you to provide this Filter subnode to limit
the information plotted using a logical expression. And, just released in v5.2 the Filter feature has become even nicer to use!
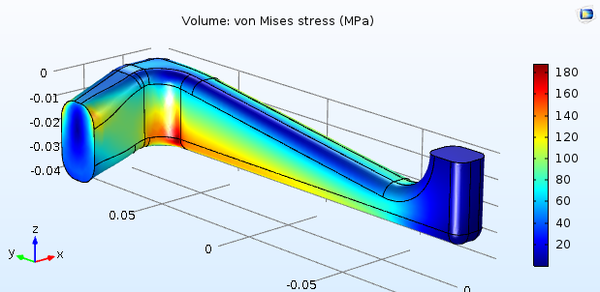
Consider the following Plot of the von Mises stress in a static loaded metal bracket.